Observability и OpenTelemetry
Observability перестала быть опцией — без неё современный сервис превращается в чёрный ящик.
Дмитрий Стародубов — Python-разработчик в Globerce Capital — погружает в мир Observability и OpenTelemetry.
В докладе: — что такое observability и чем она отличается от привычного мониторинга — три сигнала: логи, метрики и трейсинг (в т.ч. распределённый) плюс context propagation — что такое OpenTelemetry: история (OpenTracing + OpenCensus), место в CNCF и vendor-agnostic подход — практические примеры инструментации (например, opentelemetry-instrumentation-aiokafka)
Видео
Презентация
 1 / 24
Текст презентации
Слайд 1: Observability & OpenTelemetry
Observability & OpenTelemetry Dmitriy Strodubov Globerce Capital
Слайд 2: About me
About me Globerce Capital Python Developer opentelemetry-instrumentation-aiokafka
Слайд 3: Agenda
Agenda Observability OpenTelemetry Examples
Слайд 4: Observability
Observability … ability to understand the internal state of a system by examining its output ...
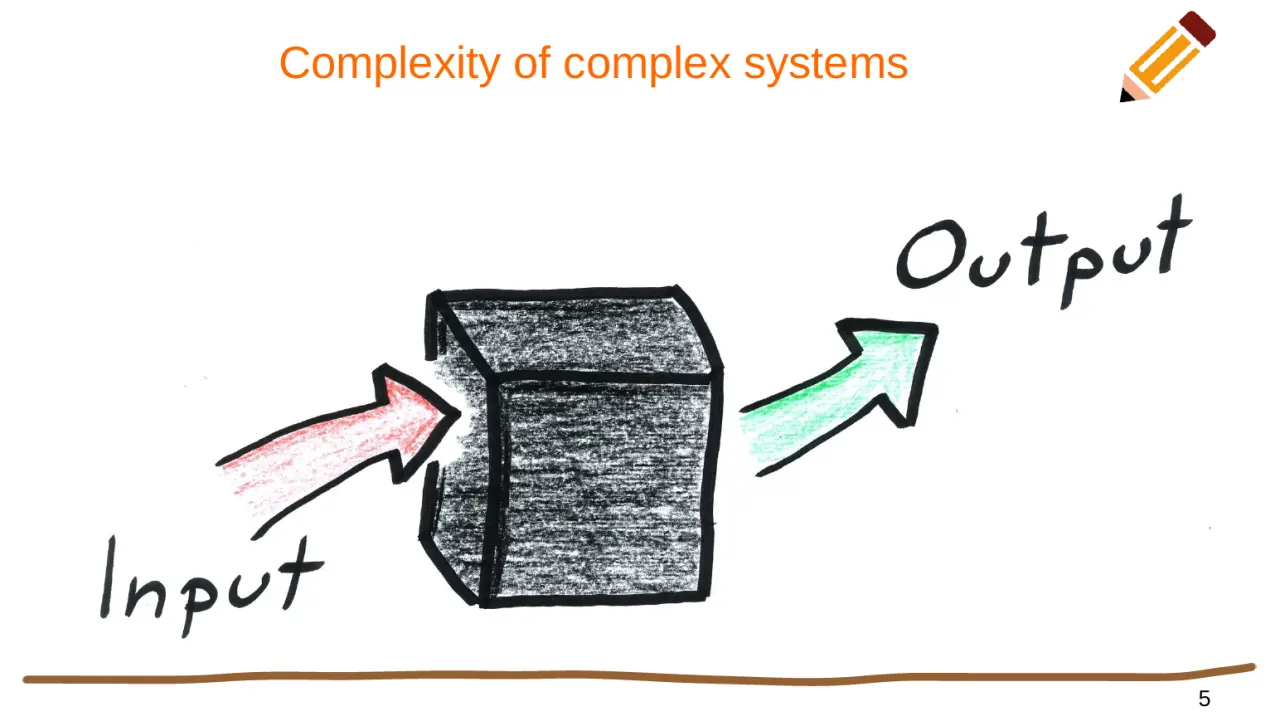
Слайд 5: Complexity of complex systems
Complexity of complex systems
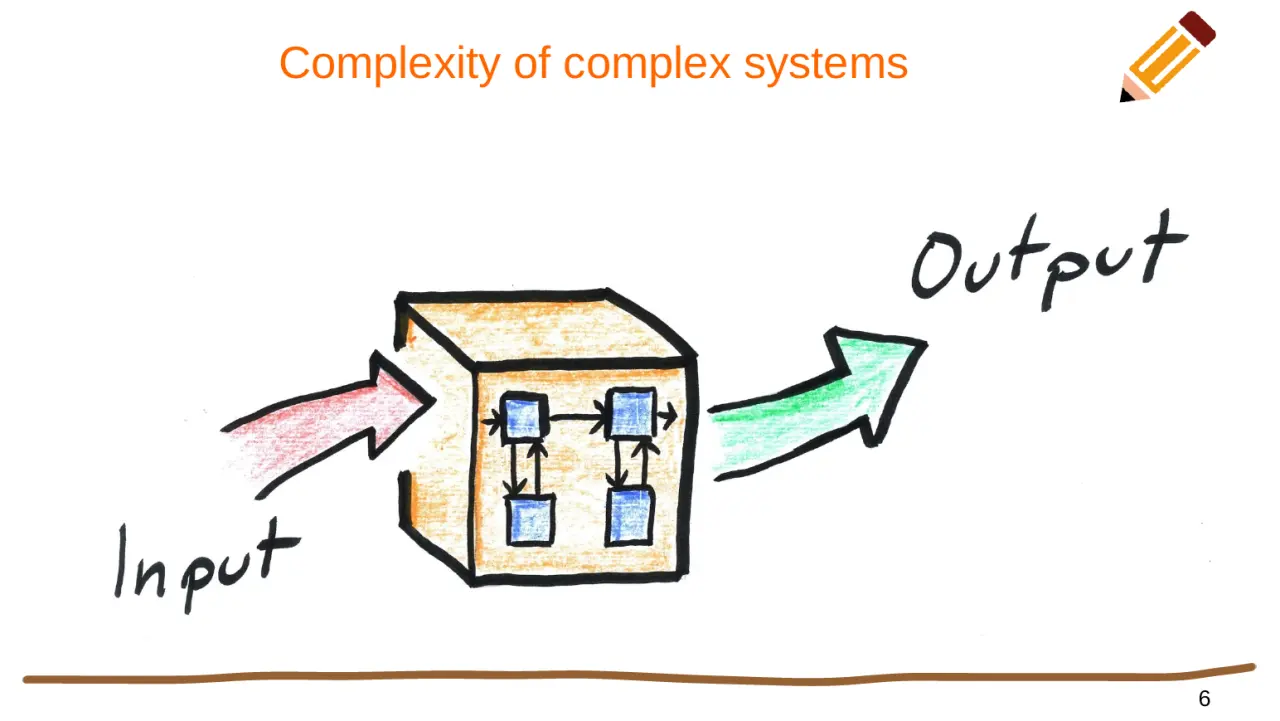
Слайд 6: Complexity of complex systems
Complexity of complex systems
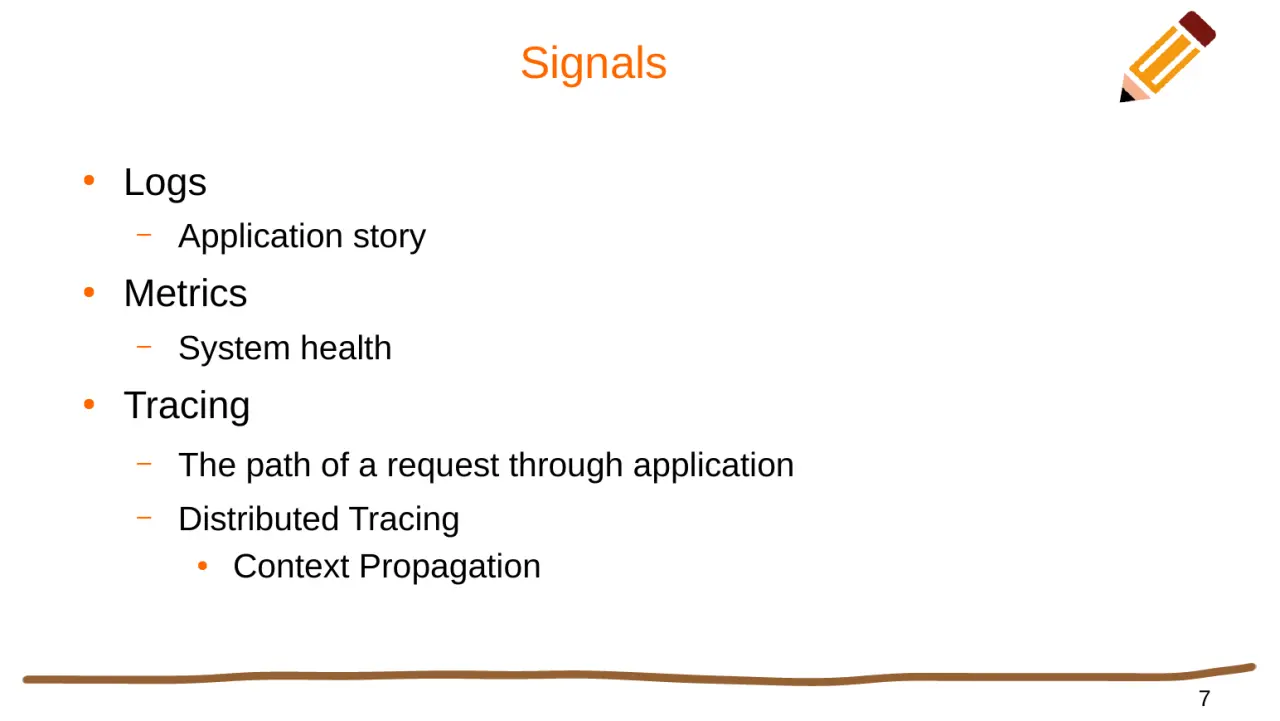
Слайд 7: Signals
Signals Logs – Application story Metrics – System health Tracing – The path of a request through application – Distributed Tracing Context Propagation
Слайд 8: Benefits
Benefits Speed up troubleshooting Finding out unknown issues
Слайд 9: Monitoring vs Observability
Monitoring vs Observability What and when? ● Why?
Слайд 10: OpenTelemetry
OpenTelemetry
Слайд 11: What is OpenTelemetry?
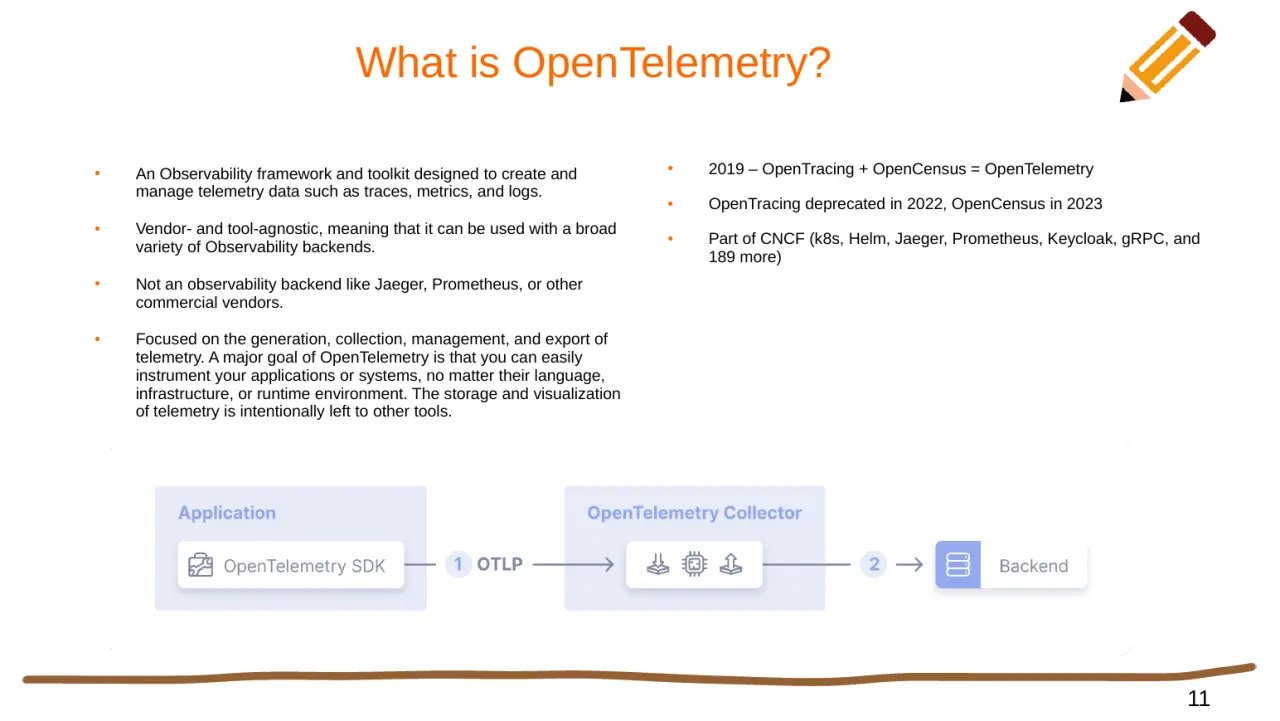
What is OpenTelemetry? 2019 – OpenTracing + OpenCensus = OpenTelemetry OpenTracing deprecated in 2022, OpenCensus in 2023 Part of CNCF (k8s, Helm, Jaeger, Prometheus, Keycloak, gRPC, and 189 more) An Observability framework and toolkit designed to create and manage telemetry data such as traces, metrics, and logs. Vendor- and tool-agnostic, meaning that it can be used with a broad variety of Observability backends. Not an observability backend like Jaeger, Prometheus, or other commercial vendors. Focused on the generation, collection, management, and export of telemetry. A major goal of OpenTelemetry is that you can easily instrument your applications or systems, no matter their language, infrastructure, or runtime environment. The storage and visualization of telemetry is intentionally left to other tools.
Слайд 12: Components
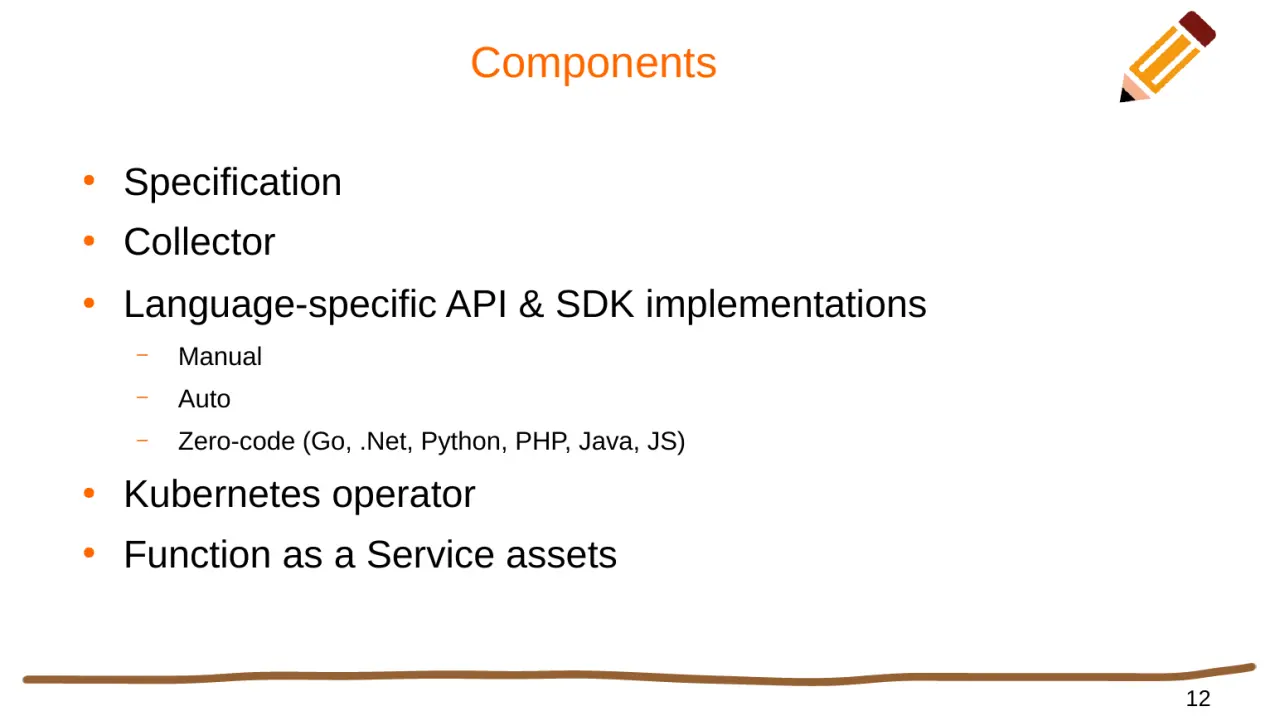
Components Specification Collector Language-specific API & SDK implementations – Manual – Auto – Zero-code (Go, .Net, Python, PHP, Java, JS) Kubernetes operator Function as a Service assets
Слайд 13: Why OpenTelemetry?
Why OpenTelemetry? Industrial standard Vendor independents Active community
Слайд 14: Distributed Tracing
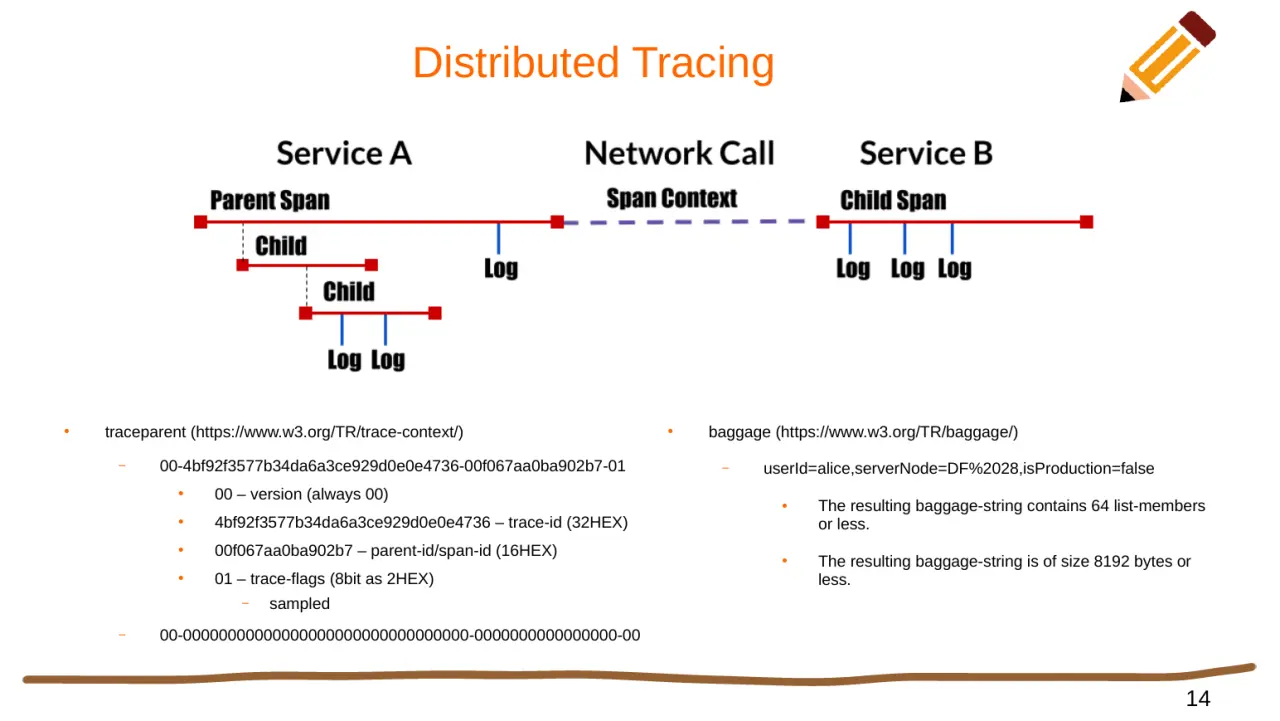
Distributed Tracing traceparent (https://www.w3.org/TR/trace-context/) 00 – version (always 00) 4bf92f3577b34da6a3ce929d0e0e4736 – trace-id (32HEX) 00f067aa0ba902b7 – parent-id/span-id (16HEX) 01 – trace-flags (8bit as 2HEX) – sampled baggage (https://www.w3.org/TR/baggage/) – userId=alice,serverNode=DF%2028,isProduction=false The resulting baggage-string contains 64 list-members or less. The resulting baggage-string is of size 8192 bytes or less.
Слайд 15: Code
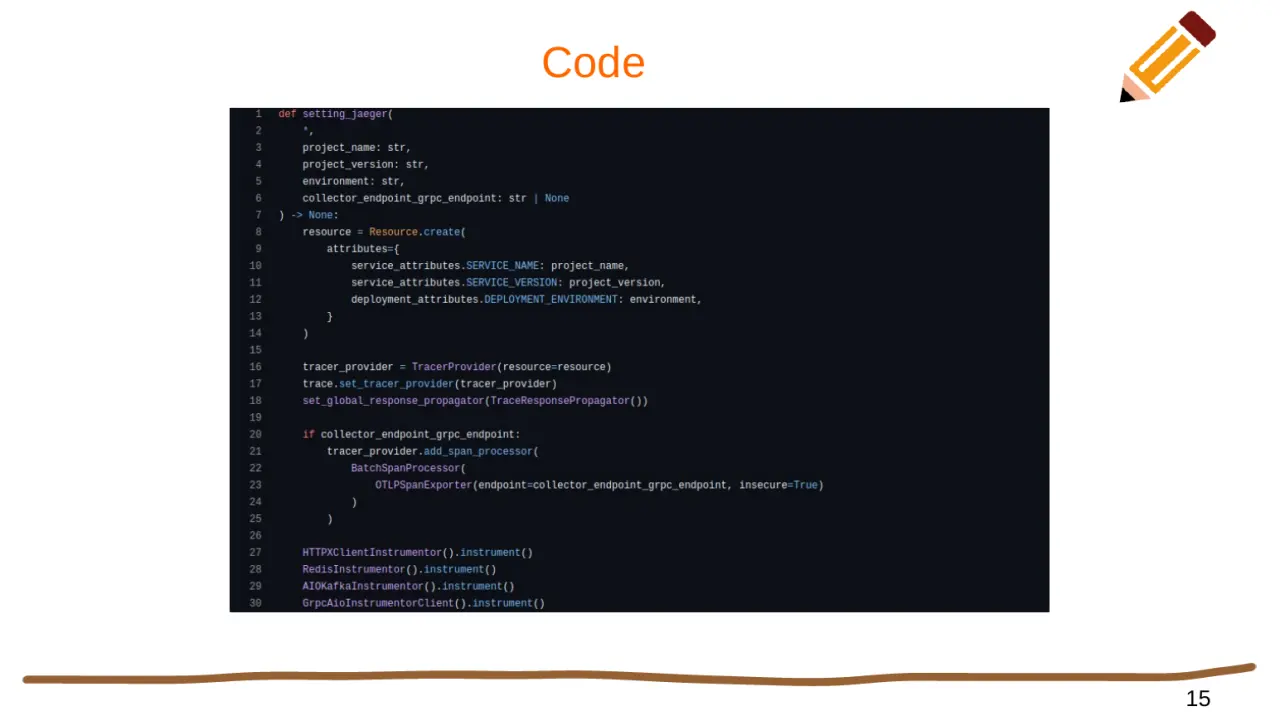
Code
Слайд 16: Performance
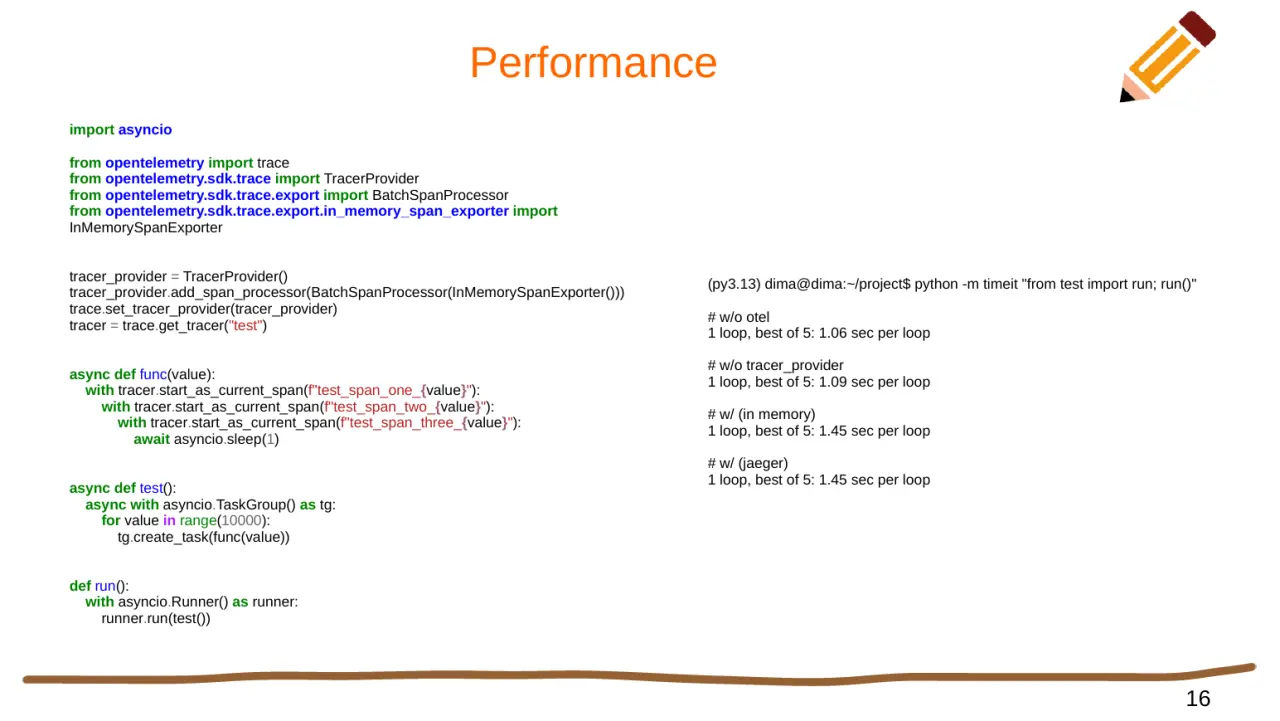
Performance import asyncio from opentelemetry import trace from opentelemetry.sdk.trace import TracerProvider from opentelemetry.sdk.trace.export import BatchSpanProcessor from opentelemetry.sdk.trace.export.in_memory_span_exporter import InMemorySpanExporter tracer_provider = TracerProvider() tracer_provider.add_span_processor(BatchSpanProcessor(InMemorySpanExporter())) trace.set_tracer_provider(tracer_provider) tracer = trace.get_tracer("test") async def func(value): with tracer.start_as_current_span(f"test_span_one_{value}"): with tracer.start_as_current_span(f"test_span_two_{value}"): with tracer.start_as_current_span(f"test_span_three_{value}"): await asyncio.sleep(1) async def test(): async with asyncio.TaskGroup() as tg: for value in range(10000): tg.create_task(func(value)) def run(): with asyncio.Runner() as runner: runner.run(test()) (py3.13) dima@dima:~/project$ python -m timeit "from test import run; run()" # w/o otel 1 loop, best of 5: 1.06 sec per loop # w/o tracer_provider 1 loop, best of 5: 1.09 sec per loop # w/ (in memory) 1 loop, best of 5: 1.45 sec per loop # w/ (jaeger) 1 loop, best of 5: 1.45 sec per loop
Слайд 17: Examples
Examples
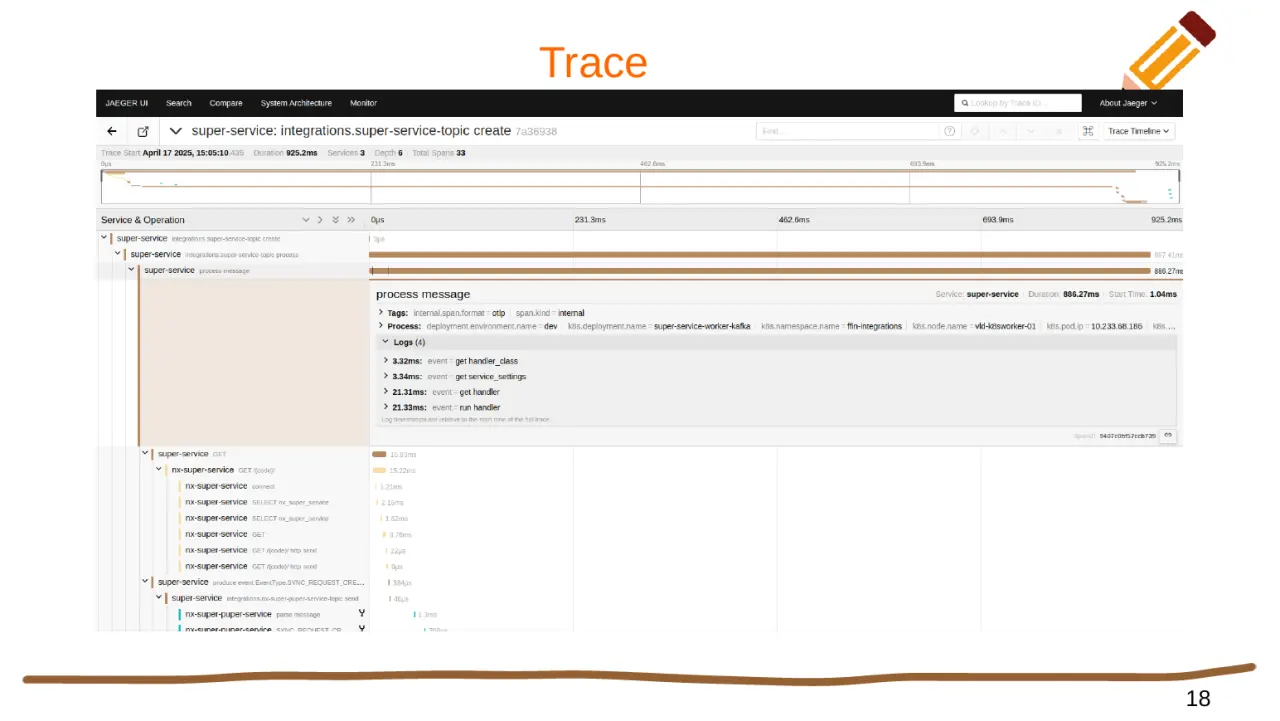
Слайд 18: Trace
Trace
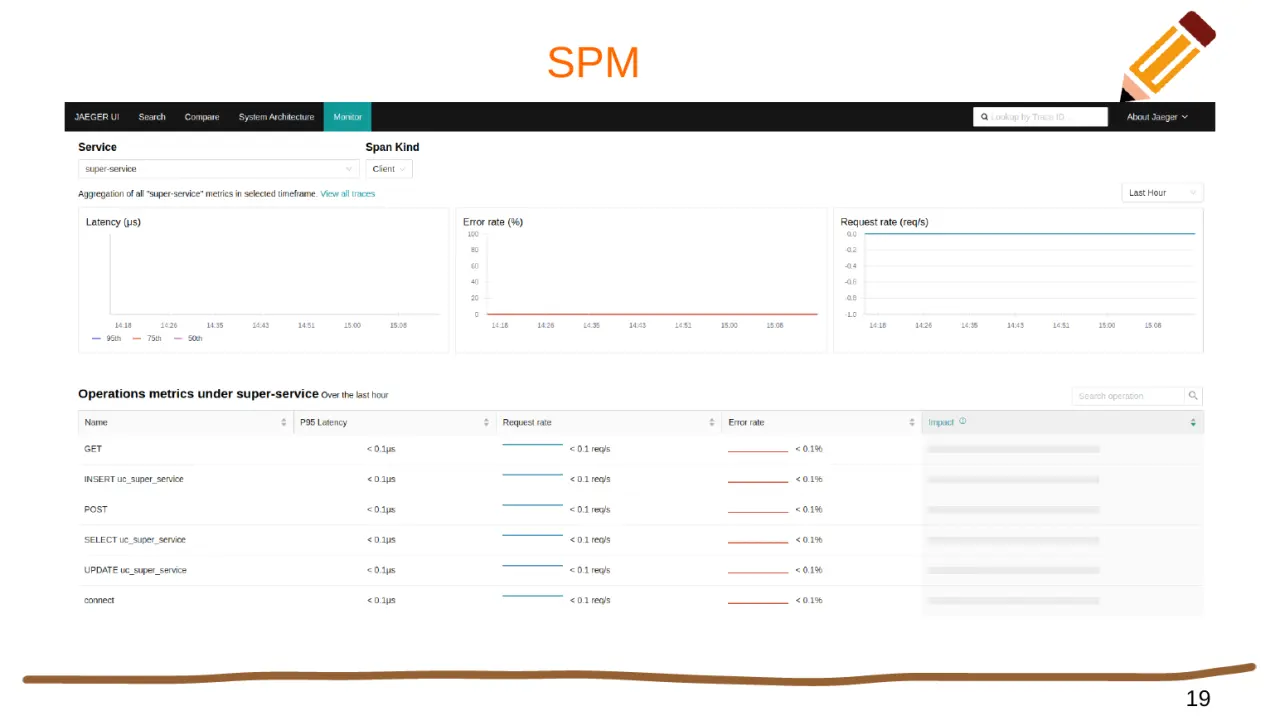
Слайд 19: SPM
SPM
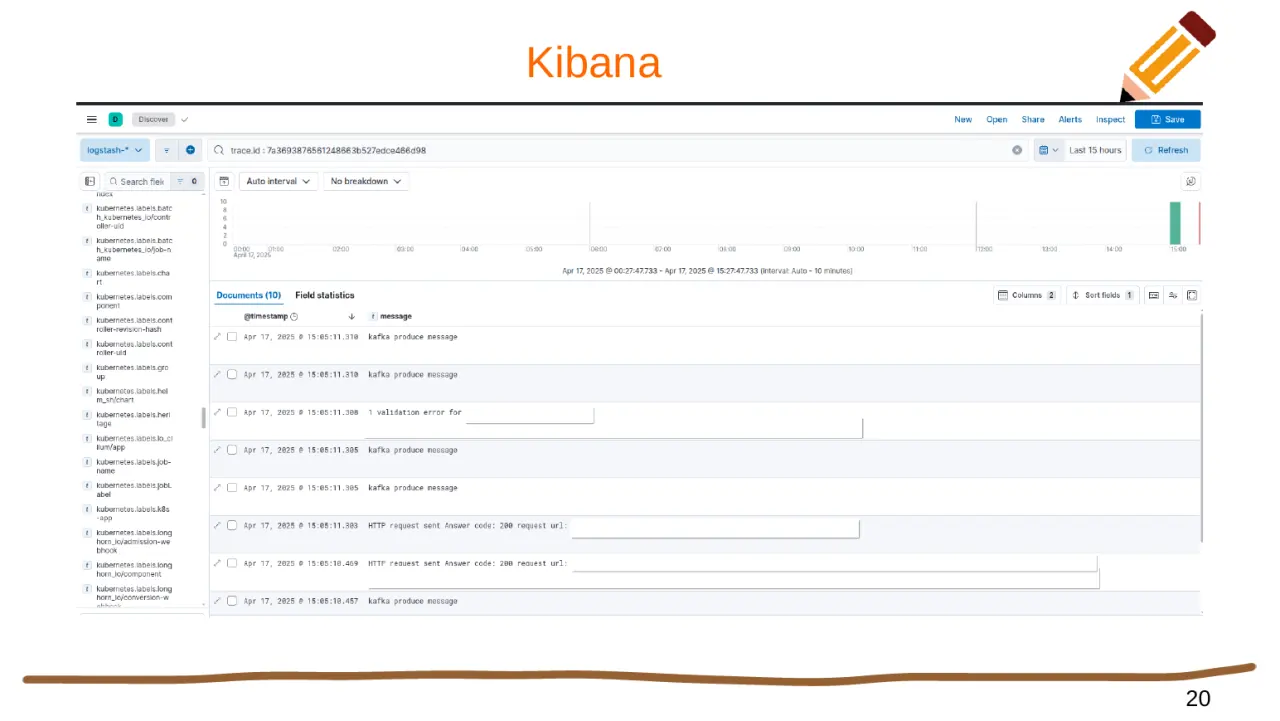
Слайд 20: Kibana
Kibana
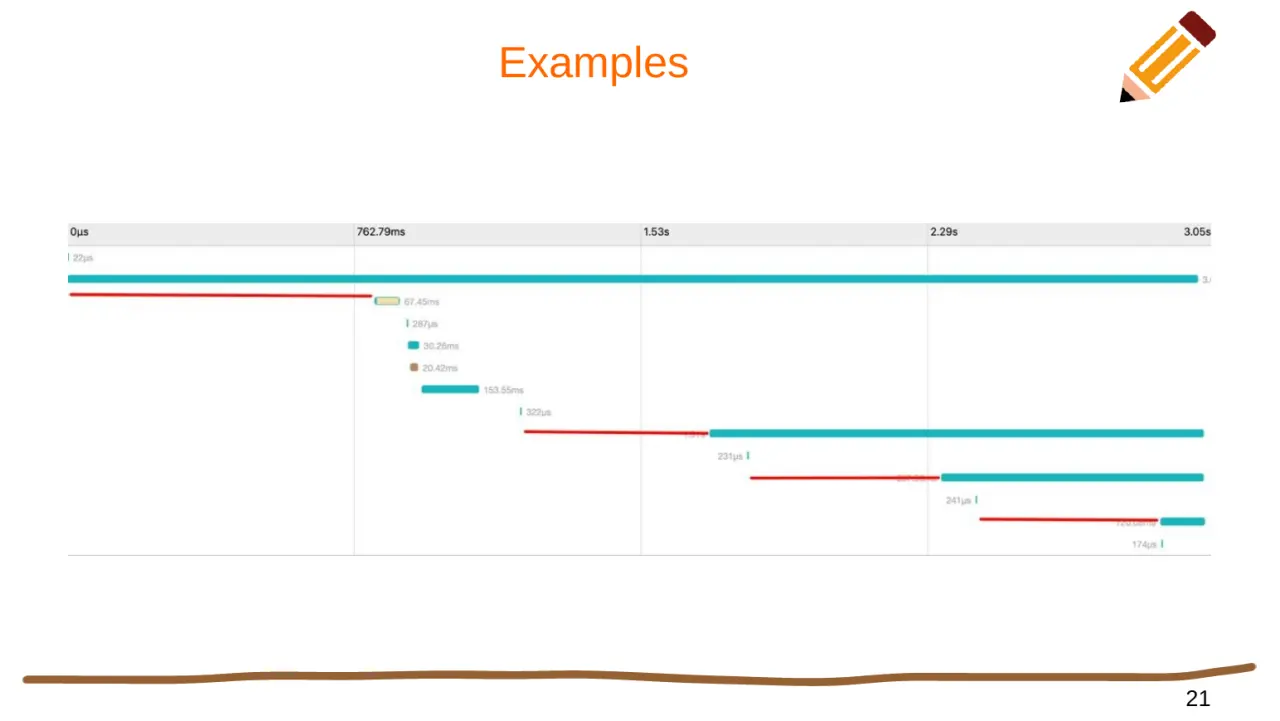
Слайд 21: Examples
Examples
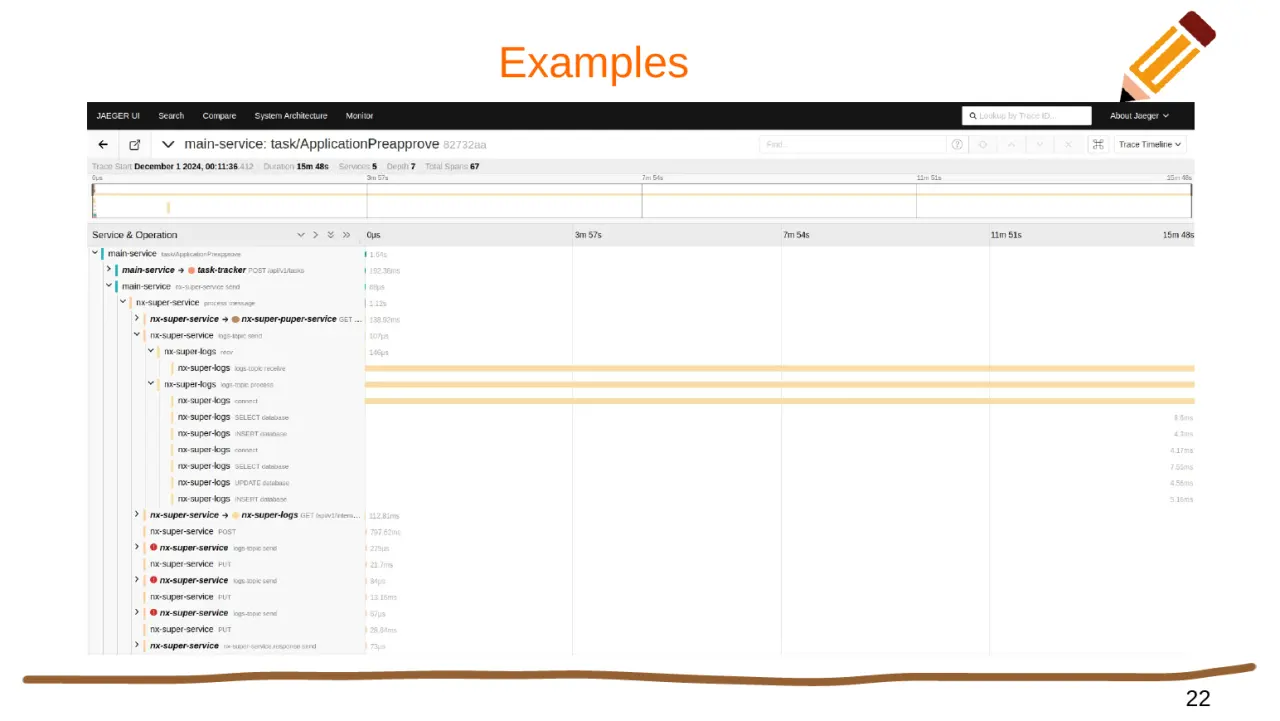
Слайд 22: Examples
Examples
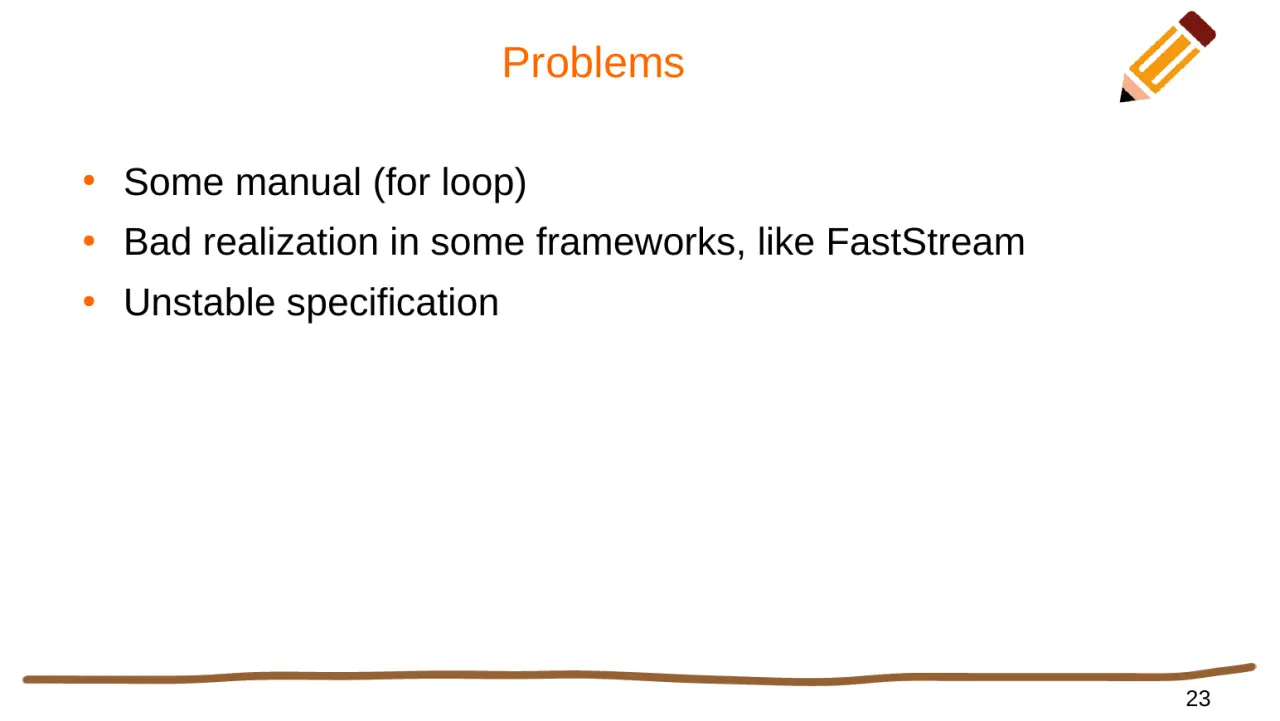
Слайд 23: Problems
Problems Some manual (for loop) Bad realization in some frameworks, like FastStream Unstable specification
Слайд 24: Questions?
Questions?
Другие доклады митапа
- АГLLM в продакшне Азамат Галимжанов
- ТКCursor и AI-ассистент в разработке Темирлан Кабылбеков
- ТИ